Electron paramagnetic resonance
Electron paramagnetic resonance (EPR) or electron spin resonance (ESR) spectroscopy is a technique for studying chemical species that have one or more unpaired electrons, such as organic and inorganic free radicals or inorganic complexes possessing a transition metal ion. The basic physical concepts of EPR are analogous to those of nuclear magnetic resonance (NMR), but it is electron spins that are excited instead of spins of atomic nuclei. Because most stable molecules have all their electrons paired, the EPR technique is less widely used than NMR. However, this limitation to paramagnetic species also means that the EPR technique is one of great specificity, since ordinary chemical solvents and matrices do not give rise to EPR spectra.
EPR was first observed in Kazan State University by Soviet physicist Yevgeny Zavoisky in 1944, and was developed independently at the same time by Brebis Bleaney at the University of Oxford.
Contents |
Theory
Origin of an EPR signal
Every electron has a magnetic moment and spin quantum number s = 1/2, with magnetic components ms = +1/2 and ms = −1/2. In the presence of an external magnetic field with strength B0, the electron's magnetic moment aligns itself either parallel (ms = −1/2) or antiparallel (ms = +1/2) to the field, each alignment having a specific energy (see the Zeeman effect). The parallel alignment corresponds to the lower energy state, and the separation between it and the upper state is  E = geμBB0, where ge is the electron's so-called g-factor (see also the Landé g-factor) and μB is the Bohr magneton. This equation implies that the splitting of the energy levels is directly proportional to the magnetic field's strength, as shown in the diagram below.
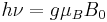
An unpaired electron can move between the two energy levels by either absorbing or emitting electromagnetic radiation of energy  = h
= h such that the resonance condition, = E, is obeyed. Substituting in = h and E = geμBB0 leads to the fundamental equation of EPR spectroscopy: h = geμBB0. Experimentally, this equation permits a large combination of frequency and magnetic field values, but the great majority of EPR measurements are made with microwaves in the 9000–10000 MHz (9–10 GHz) region, with fields corresponding to about 3500 G (0.35 T). See below for other field-frequency combinations.
In principle, EPR spectra can be generated by either varying the photon frequency incident on a sample while holding the magnetic field constant or doing the reverse. In practice, it is usually the frequency that is kept fixed. A collection of paramagnetic centers, such as free radicals, is exposed to microwaves at a fixed frequency. By increasing an external magnetic field, the gap between the ms = +1/2 and ms = −1/2 energy states is widened until it matches the energy of the microwaves, as represented by the double-arrow in the diagram above. At this point the unpaired electrons can move between their two spin states. Since there typically are more electrons in the lower state, due to the Maxwell-Boltzmann distribution (see below), there is a net absorption of energy, and it is this absorption that is monitored and converted into a spectrum.
As an example of how  = geμBB0 can be used, consider the case of a free electron, which has ge = 2.0023,[1] and the simulated spectrum shown at the right in two different forms. For the microwave frequency of 9388.2 MHz, the predicted resonance position is a magnetic field of about B0 = h / geμB = 0.3350 tesla = 3350 gauss, as shown. Note that while two forms of the same spectrum are presented in the figure, most EPR spectra are recorded and published only as first derivatives.
Because of electron-nuclear mass differences, the magnetic moment of an electron is substantially larger than the corresponding quantity for any nucleus, so that a much higher electromagnetic frequency is needed to bring about a spin resonance with an electron than with a nucleus, at identical magnetic field strengths. For example, for the field of 3350 G shown at the right, spin resonance occurs near 9388.2 MHz for an electron compared to only about 14.3 MHz for 1H nuclei. (For NMR spectroscopy, the corresponding resonance equation is = gNμNB0 where gN and μN depend on the nucleus under study.)
Maxwell-Boltzmann distribution
In practice, EPR samples consist of collections of many paramagnetic species, and not single isolated paramagnetic centers. If the population of radicals is in thermodynamic equilibrium, its statistical distribution is described by the Maxwell-Boltzmann equation

where  is the number of paramagnetic centers occupying the upper energy state,
  is the Boltzmann constant, and
  is the temperature in kelvins. At 298 K, X-band microwave frequencies ( ≈ 9.75 GHz) give
  ≈ 0.998, meaning that the upper energy level has a smaller population than the lower one. Therefore, transitions from the lower to the higher level are more probable than the reverse, which is why there is a net absorption of energy.
The sensitivity of the EPR method (i.e., the minimum number of detectable spins  ) depends on the photon frequency according to
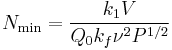
where  is a constant,
  is the sample's volume,
  is the unloaded quality factor of the microwave cavity (sample chamber),
  is the cavity filling coefficient, and
  is the microwave power in the spectrometer cavity. With and being constants, ~
  , i.e., ~
  , where
  ≈ 1.5. In practice, can change varying from 0.5 to 4.5 depending on spectrometer characteristics, resonance conditions, and sample size. In other words, the higher the spectrometer frequency the lower the detection limit (), meaning greater sensitivity.
Spectral parameters
In real systems, electrons are normally not solitary, but are associated with one or more atoms. There are several important consequences of this:
- An unpaired electron can gain or lose angular momentum, which can change the value of its g-factor, causing it to differ from ge. This is especially significant for chemical systems with transition-metal ions.
- If an atom with which an unpaired electron is associated has a non-zero nuclear spin, then its magnetic moment will affect the electron. This leads to the phenomenon of hyperfine coupling, analogous to J-coupling in NMR, splitting the EPR resonance signal into doublets, triplets and so forth.
- Interactions of an unpaired electron with its environment influence the shape of an EPR spectral line. Line shapes can yield information about, for example, rates of chemical reactions.
- The g-factor and hyperfine coupling in an atom or molecule may not be the same for all orientations of an unpaired electron in an external magnetic field. This anisotropy depends upon the electronic structure of the atom or molecule (e.g., free radical) in question, and so can provide information about the atomic or molecular orbital containing the unpaired electron.
The g factor
Knowledge of the g-factor can give information about a paramagnetic center's electronic structure. An unpaired electron responds not only to a spectrometer's applied magnetic field B0 but also to any local magnetic fields of atoms or molecules. The effective field Beff experienced by an electron is thus written
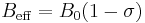
where  includes the effects of local fields ( can be positive or negative). Therefore, the h = geμBBeff resonance condition (above) is rewritten as follows:

The quantity ge(1 – σ) is denoted g and called simply the g-factor, so that the final resonance equation becomes
This last equation is used to determine g in an EPR experiment by measuring the field and the frequency at which resonance occurs. If g does not equal ge the implication is that the ratio of the unpaired electron's spin magnetic moment to its angular momentum differs from the free electron value. Since an electron's spin magnetic moment is constant (approximately the Bohr magneton), then the electron must have gained or lost angular momentum through spin-orbit coupling. Because the mechanisms of spin-orbit coupling are well understood, the magnitude of the change gives information about the nature of the atomic or molecular orbital containing the unpaired electron.
In general, the g factor is not a number but a second-rank tensor represented by nine numbers arranged in a 3×3 matrix. The principal axes of this tensor are determined by the local fields, for example, by the local atomic arrangement around the unpaired spin in a solid or in a molecule. Choosing an appropriate coordinate system (say, x,y,z) allows to "diagonalize" this tensor thereby reducing the maximum number of its components from nine to three, gxx, gyy and gzz. For a single spin experiencing only Zeeman interaction with an external magnetic field, the position of the EPR resonance is given by the expression gxxBx + gyyBy + gzzBz. Here Bx, By and Bz are the components of the magnetic field vector in the coordinate system (x,y,z); their magnitudes change as the field is rotated, so as the frequency of the resonance. For a large ensemble of randomly oriented spins, the EPR spectrum consists three peaks of characteristic shape at frequencies gxxB0, gyyB0 and gzzB0: the low-frequency peak is positive in first-derivative spectra, the high-frequency peak is negative, and the central peak is bipolar. Such situation is commonly observed in powders and the spectra are therefore called "powder-pattern spectra". In crystals, the number of EPR lines is determined by the number of crystallographically equivalent orientations of the EPR spin (called "EPR center").
Hyperfine coupling
Since the source of an EPR spectrum is a change in an electron's spin state, it might be thought that all EPR spectra for a single electron spin would consist of one line. However, the interaction of an unpaired electron, by way of its magnetic moment, with nearby nuclear spins, results in additional allowed energy states and, in turn, multi-lined spectra. In such cases, the spacing between the EPR spectral lines indicates the degree of interaction between the unpaired electron and the perturbing nuclei. The hyperfine coupling constant of a nucleus is directly related to the spectral line spacing and, in the simplest cases, is essentially the spacing itself.
Two common mechanisms by which electrons and nuclei interact are the Fermi contact interaction and by dipolar interaction. The former applies largely to the case of isotropic interactions (independent of sample orientation in a magnetic field) and the latter to the case of anisotropic interactions (spectra dependent on sample orientation in a magnetic field). Spin polarization is a third mechanism for interactions between an unpaired electron and a nuclear spin, being especially important for  -electron organic radicals, such as the benzene radical anion. The symbols "a" or "A" are used for isotropic hyperfine coupling constants while "B" is usually employed for anisotropic hyperfine coupling constants.[2]
In many cases, the isotropic hyperfine splitting pattern for a radical freely tumbling in a solution (isotropic system) can be predicted.
- For a radical having M equivalent nuclei, each with a spin of I, the number of EPR lines expected is 2MI + 1. As an example, the methyl radical, CH3, has three 1H nuclei each with I = 1/2, and so the number of lines expected is 2MI + 1 = 2(3)(1/2) + 1 = 4, which is as observed.
- For a radical having M1 equivalent nuclei, each with a spin of I1, and a group of M2 equivalent nuclei, each with a spin of I2, the number of lines expected is (2M1I1 + 1) (2M2I2 + 1). As an example, the methoxymethyl radical, H2C(OCH3), has two equivalent 1H nuclei each with I = 1/2 and three equivalent 1H nuclei each with I = 1/2, and so the number of lines expected is (2M1I1 + 1) (2M2I2 + 1) = [2(2)(1/2) + 1][2(3)(1/2) + 1] = [3][4] = 12, again as observed.
- The above can be extended to predict the number of lines for any number of nuclei.
While it is easy to predict the number of lines a radical's EPR spectrum should show, the reverse problem, unraveling a complex multi-line EPR spectrum and assigning the various spacings to specific nuclei, is more difficult.
In the oft-encountered case of I = 1/2 nuclei (e.g., 1H, 19F, 31P), the line intensities produced by a population of radicals, each possessing M equivalent nuclei, will follow Pascal's triangle. For example, the spectrum at the right shows that the three 1H nuclei of the CH3 radical give rise to 2MI + 1 = 2(3)(1/2) + 1 = 4 lines with a 1:3:3:1 ratio. The line spacing gives a hyperfine coupling constant of aH = 23 G for each of the three 1H nuclei. Note again that the lines in this spectrum are first derivatives of absorptions.
As a second example, consider the methoxymethyl radical, H2C(OCH3). The two equivalent methyl hydrogens will give an overall 1:2:1 EPR pattern, each component of which is further split by the three methoxy hydrogens into a 1:3:3:1 pattern to give a total of 3×4 = 12 lines, a triplet of quartets. A simulation of the observed EPR spectrum is shown at the right, and agrees with the 12-line prediction and the expected line intensities. Note that the smaller coupling constant (smaller line spacing) is due to the three methoxy hydrogens, while the larger coupling constant (line spacing) is from the two hydrogens bonded directly to the carbon atom bearing the unpaired electron. It is often the case that coupling constants decrease in size with distance from a radical's unpaired electron, but there are some notable exceptions, such as the ethyl radical (CH2CH3).
Resonance linewidth definition
Resonance linewidths are defined in terms of the magnetic induction B, and its corresponding units, and are measured along the x axis of an EPR spectrum, from a line's center to a chosen reference point of the line. These defined widths are called halfwidths and possess some advantages: for asymmetric lines values of left and right halfwidth can be given. The halfwidth  is the distance measured from the line's center to the point in which absorption value has half of maximal absorption value in the center of resonance line. First inclination width
  is a distance from center of the line to the point of maximal absorption curve inclination. In practice, a full definition of linewidth is used. For symmetric lines, halfwidth
 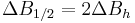 , and full inclination width
Pulsed EPR
The dynamics of electron spins are best studied with pulsed measurements.[3] Microwave pulses typically 10–100 ns long are used to control the spins in the Bloch sphere. The spin-lattice relaxation time can be measured with an inversion recovery experiment.
As with pulsed NMR, the Hahn echo is central to many pulsed EPR experiments. A Hahn echo decay experiment can be used to measure the dephasing time, as shown in the animation below. The size of the echo is recorded for different spacings of the two pulses. This reveals the decoherence, which is not refocused by the pulse. In simple cases, an exponential decay is measured, which is described by the  time.
time.
Applications
EPR spectroscopy is used in various branches of science, such as chemistry and physics, for the detection and identification of free radicals and paramagnetic centers such as F centers. EPR is a sensitive, specific method for studying both radicals formed in chemical reactions and the reactions themselves. For example, when frozen water (solid H2O) is decomposed by exposure to high-energy radiation, radicals such as H, OH, and HO2 are produced. Such radicals can be identified and studied by EPR. Organic and inorganic radicals can be detected in electrochemical systems and in materials exposed to UV light. In many cases, the reactions to make the radicals and the subsequent reactions of the radicals are of interest, while in other cases EPR is used to provide information on a radical's geometry and the orbital of the unpaired electron.
Medical and biological applications of EPR also exist. Although radicals are very reactive, and so do not normally occur in high concentrations in biology, special reagents have been developed to spin-label molecules of interest. These reagents are particularly useful in biological systems. Specially-designed nonreactive radical molecules can attach to specific sites in a biological cell, and EPR spectra can then give information on the environment of these so-called spin-label or spin-probes.
A type of dosimetry system has been designed for reference standards and routine use in medicine, based on EPR signals of radicals from irradiated polycrystalline α-alanine(the alanine deamination radical, the hydrogen abstraction radical, and the (CO-(OH))=C(CH3)NH2+ radical) . This method is suitable for measuring gamma and x-rays, electrons, protons, and high-linear energy transfer (LET) radiation of doses in the 1 Gy to 100 kGy range.[4]
EPR spectroscopy can be applied only to systems in which the balance between radical decay and radical formation keeps the free-radicals concentration above the detection limit of the spectrometer used. This can be a particularly severe problem in studying reactions in liquids. An alternative approach is to slow down reactions by studying samples held at cryogenic temperatures, such as 77 K (liquid nitrogen) or 4.2 K (liquid helium). An example of this work is the study of radical reactions in single crystals of amino acids exposed to x-rays, work that sometimes leads to activation energies and rate constants for radical reactions.
The study of radiation-induced free radicals in biological substances (for cancer research) poses the additional problem that tissue contains water, and water (due to its electric dipole moment) has a strong absorption band in the microwave region used in EPR spectrometers.
EPR also has been used by archaeologists for the dating of teeth. Radiation damage over long periods of time creates free radicals in tooth enamel, which can then be examined by EPR and, after proper calibration, dated. Alternatively, material extracted from the teeth of people during dental procedures can be used to quantify their cumulative exposure to ionizing radiation. People exposed to radiation from the Chernobyl disaster have been examined by this method.[5][6]
Radiation-sterilized foods have been examined with EPR spectroscopy, the aim being to develop methods to determine if a particular food sample has been irradiated and to what dose.
Because of its high sensitivity, EPR was used recently to measure the quantity of energy used locally during a mechanochemical milling process.[7]
EPR spectroscopy has been used to measure properties of crude oil, in particular asphaltene and vanadium content. EPR measurement of asphaltene content is a function of spin density and solvent polarity. Prior work dating to the 1960s has demonstrated the ability to measure vanadium content to sub-ppm levels.
High-field high-frequency measurements
High-field high-frequency EPR measurements are sometimes needed to detect subtle spectroscopic details. However, for many years the use of electromagnets to produce the needed fields above 1.5 T was impossible, due principally to limitations of traditional magnet materials. The first multifunctional millimeter EPR spectrometer with a superconducting solenoid was described in the early 1970s by Prof. Y. S. Lebedev's group (Russian Institute of Chemical Physics, Moscow) in collaboration with L. G. Oranski's group (Ukrainian Physics and Technics Institute, Donetsk), which began working in the Institute of Problems of Chemical Physics, Chernogolovka around 1975.[8] Two decades later, a W-band EPR spectrometer was produced as a small commercial line by the German Bruker Company, initiating the expansion of W-band EPR techniques into medium-sized academic laboratories. Today there still are only a few scientific centers in the world capable of high-field high-frequency EPR; among them are the Grenoble High Magnetic Field Laboratory in Grenoble, France, the Physics Department in Freie Universität Berlin, the National High Magnetic Field Laboratory in Tallahassee, US, the National Center for Advanced ESR Technology (ACERT) at Cornell University in Ithaca, US, the Department of Physiology, and Biophysics at Albert Einstein College of Medicine, Bronx, NY, the HLD and IFW in Dresden, Germany, the Institute of Physics of Complex Matter in Lausanne in Switzerland, and the Institute of Physics of the Leiden University, Netherlands.
| Waveband | L | S | C | X | P | K | Q | U | V | E | W | F | D | — | J | — |
|---|---|---|---|---|---|---|---|---|---|---|---|---|---|---|---|---|
 |
300 | 100 | 75 | 30 | 20 | 12.5 | 8.5 | 6 | 4.6 | 4 | 3.2 | 2.7 | 2.1 | 1.6 | 1.1 | 0.83 |
 |
1 | 3 | 4 | 10 | 15 | 24 | 35 | 50 | 65 | 75 | 95 | 111 | 140 | 190 | 285 | 360 |
 |
0.03 | 0.11 | 0.14 | 0.33 | 0.54 | 0.86 | 1.25 | 1.8 | 2.3 | 2.7 | 3.5 | 3.9 | 4.9 | 6.8 | 10.2 | 12.8 |
The EPR waveband is stipulated by the frequency or wavelength of a spectrometer's microwave source (see Table).
EPR experiments often are conducted at X and, less commonly, Q bands, mainly due to the ready availability of the necessary microwave components (which originally were developed for radar applications). A second reason for widespread X and Q band measurements is that electromagnets can reliably generate fields up to about 1 tesla. However, the low spectral resolution over g-factor at these wavebands limits the study of paramagnetic centers with comparatively low anisotropic magnetic parameters. Measurements at > 40 GHz, in the millimeter wavelength region, offer the following advantages:
- EPR spectra are simplified due to the reduction of second-order effects at high fields.
- Increase in orientation selectivity and sensitivity in the investigation of disordered systems.
- The informativity and precision of pulse methods, e.g., ENDOR also increase at high magnetic fields.
- Accessibility of spin systems with larger zero-field splitting due to the larger microwave quantum energy h.
- The higher spectral resolution over g-factor, which increases with irradiation frequency and external magnetic field B0. This is used to investigate the structure, polarity, and dynamics of radical microenvironments in spin-modified organic and biological systems through the spin label and probe method. The figure shows how spectral resolution improves with increasing frequency.
- Saturation of paramagnetic centers occurs at a comparatively low microwave polarizing field B1, due to the exponential dependence of the number of excited spins on the radiation frequency . This effect can be successfully used to study the relaxation and dynamics of paramagnetic centers as well as of superslow motion in the systems under study.
- The cross-relaxation of paramagnetic centers decreases dramatically at high magnetic fields, making it easier to obtain more-precise and more-complete information about the system under study.[8]
See also
- Ferromagnetic resonance
- Dynamic nuclear polarisation
- Spin labels
- Site-directed spin labeling
- Spin trapping
References
- ^ Odom, B.; Hanneke, D.; D'Urso, B.; and Gabrielse, G. (2006). "New Measurement of the Electron Magnetic Moment Using a One-Electron Quantum Cyclotron". Physical Review Letters 97 (3): 030801. Bibcode 2006PhRvL..97c0801O. doi:10.1103/PhysRevLett.97.030801. PMID 16907490.
- ^ Strictly speaking, "a" refers to the hyperfine splitting constant, a line spacing measured in magnetic field units, while A and B refer to hyperfine coupling constants measured in frequency units. Splitting and coupling constants are proportional, but not identical. The book by Wertz and Bolton has more information (pp. 46 and 442). Wertz, J. E., & Bolton, J. R. (1972). Electron spin resonance: Elementary theory and practical applications. New York: McGraw-Hill.
- ^ Arthur Schweiger, Gunnar Jeschke (2001). Principles of Pulse Electron Paramagnetic Resonance. Oxford University Press. ISBN 978-0198506348.
- ^ "Dosimetry Systems". Journal of the ICRU 8 (5). 2008. doi:10.1093/jicru/ndn027.
- ^ Gualtieri, G.; Colacicchia, S, Sgattonic, R., Giannonic, M. (2001). "The Chernobyl Accident: EPR Dosimetry on Dental Enamel of Children". Applied Radiation and Isotopes 55 (1): 71–79. doi:10.1016/S0969-8043(00)00351-1. PMID 11339534.
- ^ Chumak, V.; Sholom, S.; Pasalskaya, L. (1999). "Application of High Precision EPR Dosimetry with Teeth for Reconstruction of Doses to Chernobyl Populations". Radiation Protection Dosimetry 84: 515–520. http://rpd.oxfordjournals.org/cgi/content/abstract/84/1-4/515.
- ^ Baron, M., Chamayou, A., Marchioro, L., Raffi, J. (2005). "Radicalar probes to measure the action of energy on granular materials". Adv. Powder Technol 16 (3): 199–212. doi:10.1163/1568552053750242.
- ^ a b c EPR of low-dimensional systems
External links
- Electron Magnetic Resonance Program National High Magnetic Field Laboratory
- Electron Paramagnetic Resonance (Specialist Periodical Reports) Published by the Royal Society of Chemistry